Skip links

DK-200 On-Line Cylinder Pressure Analysis

Engine Surveillance System

The DK-200 is a powerful combustion surveillance system that allows engines to be continuously monitored and have any issues alerted as they happen.  Up to 16 cylinders can be measured simultaneously with data being transfered via an ethernet LAN to a Windows PC running the feature-rich viewing and analysis software.  External viewing software means that engine performance can be observed from several locations anywhere in the world.

A dashboard of key user-definable parameters is displayed on the computer screen.  If any value deviates from a predefined level, a colour-coded alert or alarm is raised.  The software incorporates Icon Research’s powerful Version 6 analysis software enabling further analysis of pressure traces to be carried out, including cylinder and engine comparisons.  Real-time displays of pressure traces are available enabling the effect of any engine adjustment to be seen as it happens.

In summary, the DK-200 system offers the ultimate in engine monitoring – simultaneous cylinder measurement with real-time display and alarming, backed up with powerful analysis tools.

Engine Condition Monitoring Solution

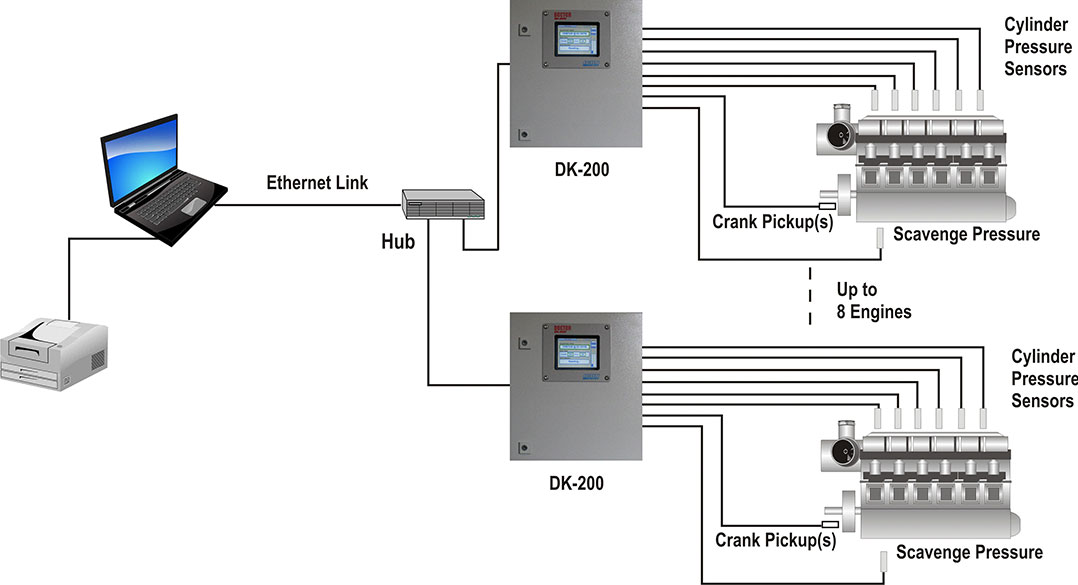
The diagram below shows the system configuration.  Sensor and all other cabling is terminated at a single rugged enclosure.  A full-colour touch screen makes setup straightforward and provides a real-time display of indicated power and engine speed in the engine room.  Multiple DK-200 units are connected over the ethernet network.
Features

As well as displaying engine data on real time, the on-line systems can be configured to record readings automatically at pre-set intervals, or a recorded snapshot can be taken at any time by the click of a button.  Meanwhile the system monitors the engine(s) 24/7, and a visual display is available at all times.  Readings can be transferred into the same software package as used by the portable Doctor.

To ensure the highest accuracy, especially for calculated power, only the highest quality sensors and pickups are used.  The pressure sensors have high temperature resistance and a long, stable operating life.  The DK-200 software incorporates self-checking of pressure sensors and shaft pickups to ensure reliable operation.  If a sensor goes out of specification, this is highlighted on the dashboard.

A number of mounting solutions are available for the permanently fitted pressure sensors.  These include a range of adapters that fit under the indicator valves as well as dual-port indicator valves to which the pressure sensor can be fitted while leaving the Thompson adapter thread free for other temporary connection.

Twin inductive crank pickups eliminate the effects of speed variation for the highest accuracy on main engines.  Single inductive crank pickups give an economical oil and dirt immune system for generators and auxiliary engines.

Installation and commissioning services are available through Icon and there are agents in several locations throughout the world who can supply installation and commissioning services.  However, installation is quite straightforward and can be handled by local contractors and, often, the ship’s crew.

Detailed instructions are provided together with start-up and commissioning notes.  Note that the DK-200 can be set up and have its sensors checked locally prior to the network being connected up.

Most of Icon’s customers self-start their Doctor systems.  Clear instructions for installation of the software are provided.

To assist with initial setup of the software, a database set-up service is available.  When this option is purchased, the Doctor system is delivered with a database configured for the ship.  Initial results are then emailed back to Icon for the trigger angle correction.  This option is the most cost effective and fastest way to start up a Doctor on-line system.

There is no need to wait for a convenient port or short sailing where an engineer could attend the vessel.  The corrected database file is normally emailed back to the vessel within a couple of days of the initial readings being taken.

On-Line Analysis Software

The DK-200 engine surveillance system is supported by a comprehensive software application that displays measurements from one or more DK-200’s in real-time.  Displays are configurable depending on the engine(s) being monitored, for example, number of cylinders, measurement types etc.  Multiple engines, including a mix of 2-stroke and 4-stroke, can be displayed simultaneously on the dashboard.

The software can display an overall summary of the status of all engines using a simple “traffic light” summary.  All green means that all measurements are with pre-determined limits.  Yellow means that a measurement is slightly outside and should be checked, and red means that a close look should be taken.  Clicking on a particular engine displays more detail.  Going further down the hierarchy enables graphs and tables of single and multiple engines to be displayed in real time.

The DK-200 on-line software incorporates the popular Doctor Version 6 software module.  This provides the full graphic and tabular displays available in Version 6.  Importantly, it includes the Diagnostic option which means that instant diagnostics can be displayed for each measurement set as it comes in from the DK-200 over the network. This enables users to track in real time what may be happening on their engines.
Features

Setting up the DK-200 to take the desired measurements could not be easier.  First, the ethernet network is configured to enable one or more DK-200’s to communicate with the host computer.  Then, engine configurations and measurement settings are defined in the online software.

Users will find many similarities between the online and portable versions of the software, enabling easy familiarisation with the already highly intuitive features.

The Overall screen shows the status of the engines that are being monitored, enabling a summary of all of the engines to be seen at a glance.  From here, you can view the details of any particular engine on a cylinder-by-cylinder basis.

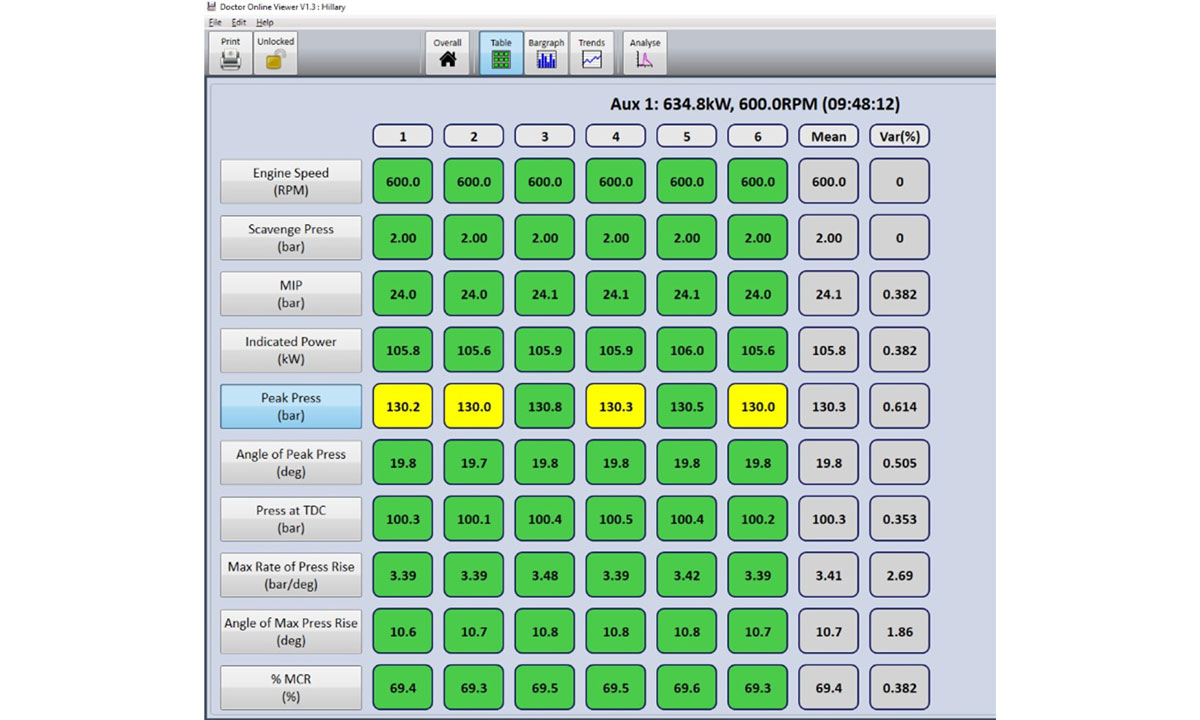
The Table screen shows the values of pre-selected scalar values on a cylinder-by-cylinder basis, enabling a quick comparison of values to be seen.  Values such as Pmax and Angle of Pmax can be directly read in the Table screen together with derived (calculated) values such as MIP and power.

Selected parameters can be viewed as bargraphs on a cylinder-by-cylinder basis for a graphical comparison.  Bargraphs are colour-coded depending on the alarm status of each cylinder.

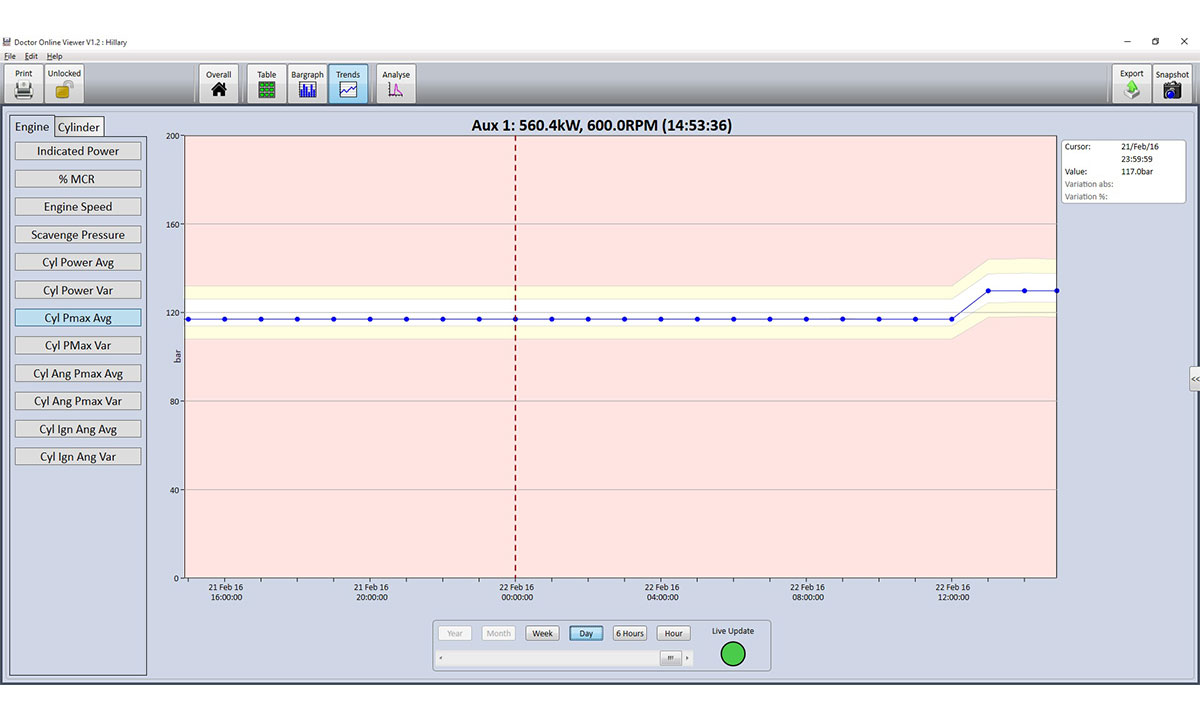
The Trend screen shows historical values for various parameters for multiple cylinders, allowing quick comparison of historical data and trends to be observed.

Similar information is available in the Histogram screen where bar graphs present the data in an easily understood format.

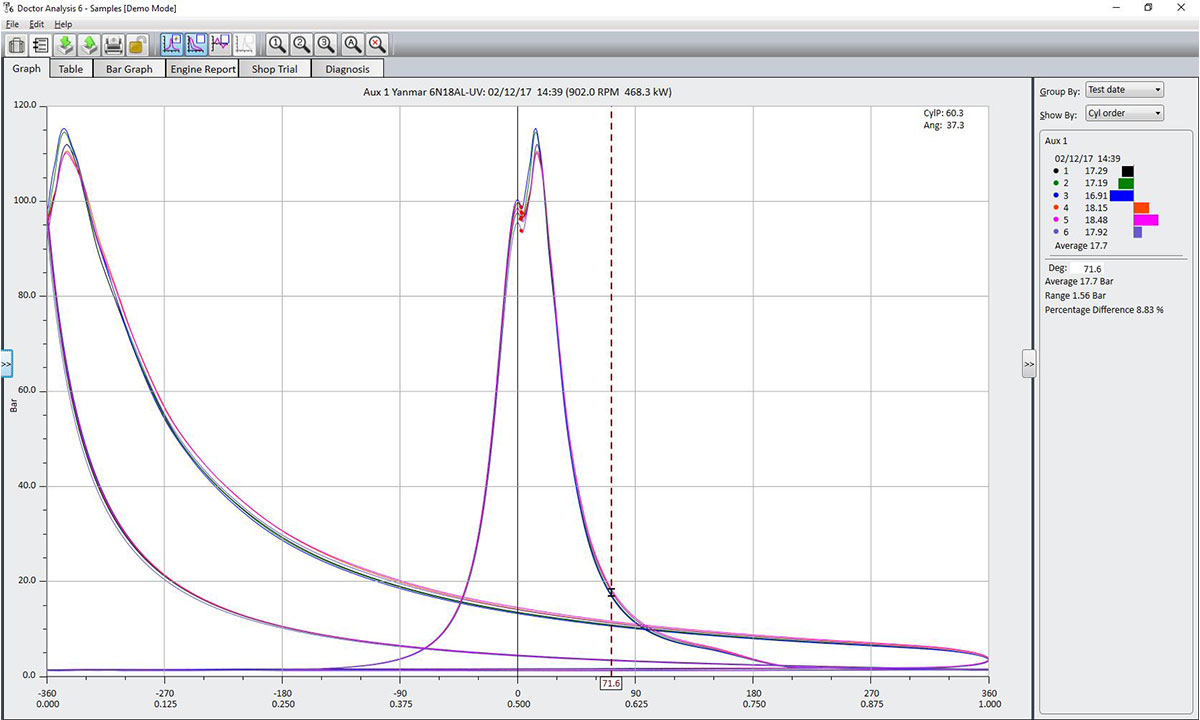
The Analysis screen shows live traces for the cylinders and it is possible to use many of the features that are available in the Doctor Version 6 software, including data set selection, zooming, cursors, alternative trace types (pressure-angle, P-V diagrams and rate of change of pressure plots), and instant diagnostics.

Traces can be viewed live and will show exactly what your engine is doing in real time.  Scalar data (such as the trend values) may be stored at a more frequent rate than trace data if required to save on memory in the PC.

Request a Quote

Request a Quote